How To Model Google Analytics SSL Data
Google’s decision to remove traffic information about Google Account holders who are logged in when they visit your website using Secure Socket Layer SSL protection in the name of “privacy” can cause data comparison pain as well as a heart attack or two. When you see “not listed” in your analytics (starting from about October 2011), the “not listed” number represents traffic whose details are now hidden. To create an approximation of your actual numbers to compare to baselines, follow these few simple steps.
Step 1: Determine the SSL Traffic as % of Total Visits
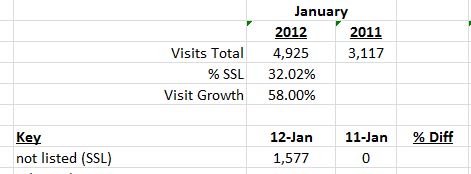
SSL varies by time, so be sure to limit the range to whatever time constraints you are using. Here is a recent spreadsheet in which I was working by months:

In January, Atlanticbt.com had 4,925 visits: a 58% growth over January 2011’s 3,117. January 2012 had 1,577 “hidden” or Not Listed visits, for 32% of the total.
February had 33% Not Listed, and June had 40%. The Not Listed SSL number has been going up as more and more traffic logs in to Google and then surfs the web. Be sure to be careful about using time consistently in your Not Listed SLL calculation. Don’t model on a single month alone if you are working by months. If you aren’t worried about being exact, you could use a longer time frame, say, six months, then average the % of Not Listed as a % of the total, and apply that number across the board. I personally don’t mind doing the work by month when I’m already working that way and there is a big difference between 32% Not Listed in January and 40% in June.
Step 2: Determine an Adjusted 2012 Number
If a keyword or page had 509 visits in January 2012, we know that isn’t the “true” number due to the 32% “not listed” traffic generated by people signed into their Google accounts and thus hidden from our view.
We need to adjust the 2012 number to add back the hidden Not Listed. Once we have the “Not Listed” % of total (32%), it is easy to create an adjusted number:
509 X 1.32% = 162.983
509 + 162.983 = 671.983 (672 rounded)
Step 3: Compare to 2011 baseline
Once we have an adjusted 2012 number, compare the adjusted number of 672 to 2011’s actual. Let’s say it was 670.
You can then see that your adjusted number is +2 your 2011 baseline and not a steep drop of -161 as it first appeared (509 non-adjusted vs. 670). The non-adjusted number can cause stress and pain, the adjusted number may help calm the nerves.
SSL Modeling for Heart Attack Avoidance
Google’s change will eventually be moot, as SSL “Not Listed” will be in your current and comparison set. Once SSL is in both sets, then you have a modeled system that can determine how SSL should be categorized easily (just use the non-SSL numbers to create % by action). Until Not Listed is in this year’s and last year’s numbers, use the simple steps outlined above to model an adjusted number BEFORE you show your boss. No need for both of you to have heart attacks (lol).
Note From A Friend
My Friend Phil Buckley Tweeted (@1918) that he thought some would read this post and model too much data in this fashion and then find the point of uncertainty when “Not Listed” reaches beyond 50%, as it may soon. I reminded Phil of Taleb’s book The Black Swan.
My Black Swan take away is that everything is a guess. Some guesses are more informed than others. If you are comfortable with a spreadsheet and statistics, you could model your entire site from 10% to 20% of actual data. When I managed a large ecommerce site, I could FEEL if something was wacky long before the source of my dissonance showed up in the data. Is that HEALTHY? Not at all (lol).
I’ve also blogged about the relative nature of what we as Internet marketers really KNOW. What we KNOW for sure is what is happening NOW. Until GA’s real time moves further out of beta, we look at the past and hope to understand our website’s NOW and its immediate future. There is another way of saying this: We guess.
– Marty


