Let’s pretend we run a B2B website where management is not certain about the Return On Investment (ROI) from Internet marketing. One way to protect your company’s investment and build support for your marketing is create daily Key Performance Indicators (KPIs). Instead of explaining Daily KPIs step by laborious step I’m going to toss us into the deep end of the pool and explain how to swim.
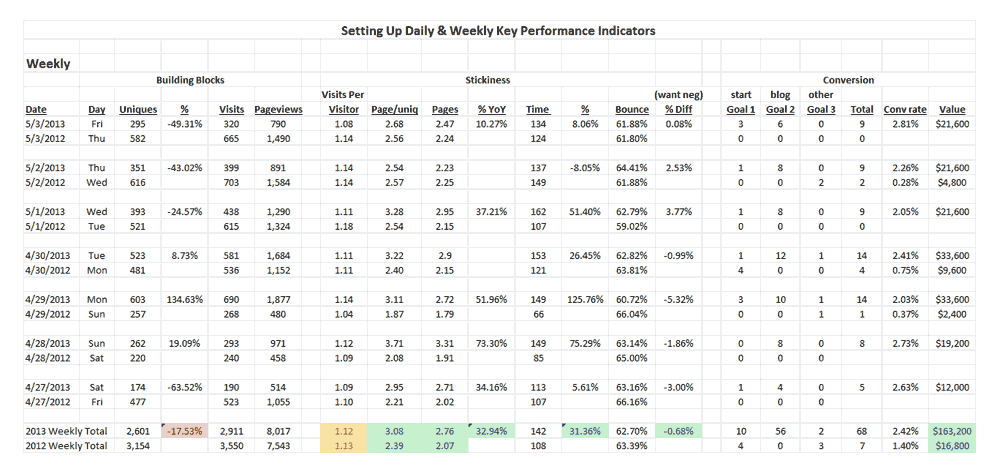
Here is the deep end of the pool:

You may want to Zoom in since I couldn’t make the type larger and not have the page take forever to load (an SEO sin). Daily KPI numbers are divided into:
- Building Blocks – Base numbers such as unique visitors and visits that feed other important calculations.
. - Stickiness – Measures critical website “heuristic” measures, or how the site is being used and liked (or not).
. - Conversion – Is the website doing what you want it to do. Note I assigned a $2,400 value to each conversion based on internal numbers. The value of your conversion may very.
.
Daily KPIs: Building Blocks
Date & Day
When comparing Yesterday to the Same Day Last Year including date and day helps. Most B2B websites go to sleep over the weekend. Knowing what day your comparison is comparing against is valuable. In the example above we would expect Monday’s numbers to beat a Saturday.
Uniques
Unique traffic to your website created by planting a “cookie” (little piece of code on a visitors computer). A person can only be “unique” once. There is a “cookie erase” controversy. People who erase cookies can appear as a “unique” visitor twice. Don’t sweat a detail that fine BECAUSE it is true across your model.
Web analytics are NOT a search for absolute mathematical truth. Web analytics are a search for marketing truth. We create models to find Internet marketing truth. In our Internet marketing models consistency trumps absolute accuracy. Don’t trip over million dollar bills to pick up nickels.
% – The % gain or loss vs same day last year.
Visits – How many visits were made to the website. Visits will always exceed uniques because some visitors visit more than once.
Pageviews – Aggregate of pages served for the period (in this case for a single day).
Daily KPIs: Stickiness
Stickiness is how well your website engages visitors. Stickiness metrics are sometimes called “heuristic” measurements. Heuristic measures are beyond important after Google’s Panda and Penguin algorithm changes. Google’s changes place high value on engagement. Website engagement is measured by heuristics.
Visits per Visitor – Calculation: total visits / uniques.
Sometimes called “repeat visits” or “repeat visitors” this metrics tells you how often visitors return to your website. You want this number to go UP and it will do so very slowly over time if your engagement metrics improve. In our example Visits per Visitor is down slightly from 1.14 last year to 1.10. Not down so much that I would panic, but worth watching as we expand out to weekly, monthly, quarterly and yearly numbers.
Pages Per Unique Visitor – Calculation: Pageviews / Uniques.
Pages divided by unique traffic provides a sense of if each unique visitor is engaged MORE or LESS. You want this number to go UP. This is a “nice to have” metric that confirms other metrics, so I don’t calculate a % to see a trend here. I can get the trend from other more important metrics such as Visits per Visitor, Pages and Time.
Pages
Comes from Google analytics on the Audience – Overview page. Number is pages viewed per average visitor with repeat pages counted. This means if a visitor travels down a menu and returns to the homepage the homepage is counted twice. There is a ratio between pages and time. Average pages per visit in the 3 to 6 range is good. Anything above 6, remember these are AVERAGES, is astronomical. This metric moves SLOWLY. You want to watch its trend over time and hope that your number is moving UP.
%YoY – Since Pages is a major “trending” heuristic it is a good idea to divide current by past to see how you are doing.
Time (seconds)
I convert Google’s minutes on our website to seconds for ease of math purposes. This is another major trending metric especially after Panda and Penguin, so divide current by past.
Bounce Rate
Google wants your website to be sticky, so you want bounce rate to trend DOWN. Bounce rates in the sixties are not uncommon. A bounce rate below 50% may mean your don’t have enough traffic visiting your website. Bounce rate exposes the two sides of web metrics. You want your metrics to IMPROVE, but improve too much and something is WRONG (lol). Welcome to Internet marketing.
Daily KPIs: Conversion
I can’t know your “conversion” points, but they are always “triggered” events. You want visitors to take some action such as: subscribe to your email list, fill out a form, request a call. These actions are “conversions” and can be tracked in Google Analytics as “Goals”. Goto the Conversions – Goals – Overview tab. This will show a summary of the goals you’ve created off of triggered events (clicks = a “triggered event”).
Goal 1 – 3 – These are goals we’ve defined.
Total – Summary of the defined goals.
Conversion Rate – Calculation: Total Conversion / Visits. Use visits not unique because every visit can produce a conversion.
Value
Value of a conversion * total conversions (a simple way to create “value” is take gross sales last year and divide by conversions). I realize such a fuzzy metric will make some financial types nervous. Value COULD BE ANYTHING. Since we don’t care as much about accuracy as consistency, the TREND of value is more important to Internet marketing than its “dollars to the bank” accuracy. Yes some websites will have the financial acumen to figure the model to 10 digits of Pi. I could care less and would argue such absurd uses of time end up costing money instead of making it. Slap a value on your conversions and then trend it over time. You can debate the CFO on how accurate you are later.
Daily KPIs Example Conclusions (the green and red boxes)
A single day evaluated by itself doesn’t say much. The discipline of looking at KPIs daily is what creates insight. On balance May 6th looks good. Uniques were up, Visits Per Visitor was down and that deserve a “watch”, more people visiting looked at more pages and spent a lot more TIME so we didn’t sacrifice heuristics to bring in more traffic.
We are comparing a Monday to a Saturday and such a comparison is almost useless in a B2B website. I would connect to weekly, monthly, quarterly and yearly KPIs to know if the “watch” on Visits Per Visitor is an alarm or an anomaly. Since I brought up connecting to weekly KPIs let’s dive a little deeper into our KPI pool and look at Weekly KPIs:

Week over Week Analysis
Does our “watch” on Visits Per Visitor need a “deep dive” to figure out what is going on? Probably not based on comparing a week in April / May to the same week last year. We see an average of 1.12 for Visits Per Visitor and we know this metric moves SLOWLY and in tiny increments, so our single day 1.10 isn’t so dramatic as to call for a deep dive.
In the weekly data our unique traffic is down by 17%. I know the source of the difference. We had a promotion last year we didn’t repeat this year. I don’t panic about unique traffic UNLESS other numbers are trending down too. Use numbers like Pages Per Unique Visitor to know if your website’s engagement is UP even as its traffic is DOWN.
The other reason I wouldn’t panic is this year we converted at 2.42% vs. 1.40% last year banking $163,000 to $16,800, a 871% improvement. That number is TOO GOOD, but again I know the source. I added a goal that wasn’t in last year, so if I wanted a strict apples to apples comparison I would model OUT the difference.
Keep good Notes
I am the WORST person to tell you to keep good notes (lol). If I get hit by a car there will be no note about our Curation Contest or my addition of goals. Since metrics extend over time keeping good notes about daily anomalies or special circumstances will prove helpful when you look back and forget what you or what happened last year. If your site goes down for more than a burp, NOTE IT or you may spend days trying to discover why your daily KPIs are so messed up.
Spreadsheets & Discipline
Wish there was some way to create a daily KPI log OTHER than Excel. If there is one I don’t know it. If you know of a better, less manual way please share in a comment. When I managed $6M in annual e-commerce revenue I checked daily KPIs first thing in the morning. 99% of the time daily KPIs are IN LINE with your modeled expectations. When your KPIs are in line go about your job.
1% of the time your KPIs will trend way out of line with your modeled expectations.
NEVER ignore those days. In a modeled world like the web any variation beyond a half a point of standard deviation (give or take your metrics) deserves a quick review. When you see a full point or two of standard deviation difference then you should close your door and say, “DIVE, DIVE, DIVE” because something bad is happening.
Your website is ON FIRE and it is your job to put it out.
One scary story to sink the point. One October my team found a full 3 point POSITIVE visitor number. We modeled at X and the number we got was 3 full percentage points higher WITHOUT a corresponding increase in the number of conversions. We had substantially more traffic acting like substantially LESS traffic.
We were under a “spam attack” from a competitor.
Spam attacks are when competitors hire proxies to bomb your website with “bad neighborhood” links. The result of such a “spam bomb” is a momentary increase in traffic and then a Google smackdown as your website is labeled “spammer”. We saw the source and reported the links. Now you can use a “disavow” command if you know what you are doing.
The point to my scary story is know your model.
Any movement beyond your modeled expectations should be investigated. Dramatic movements mean your website is on fire and you must put it out before it burns to the ground. Will your website be attacked as the one I managed was? Attacks are increasing and from strange sources, so watch your Daily, Weekly, Monthly, Quarterly and Yearly KPIs like a hawk on a wire looking for dinner and remember to “stay calm and carry on”.
Join and Follow Atlantic BT
Follow @Atlanticbt on Twitter.
Like Atlantic Business Technologies on Facebook.
Follow @Scenttrail (Marty) on Twitter.


